Platform
Developers
Resources
Documentation
Walkthrough Guides
SDKs and APIs
Integrations
A/B Testing Calculator
How Statsig Works
Blog
Support
Customer Stories
Events
Build vs Buy
Contact Sales
Feature Flags Liberated
Gating features is a core part of the development process. And with Statsig, it's free.
How AI Companies Use Statsig
The best AI companies use Statsig to accelerate growth. Learn how you can do the same.
What is Product Observability?
Product observability means being able to monitor, control, and gain insight into all of your features.Documentation
Walkthrough Guides
SDKs and APIs
Integrations
A/B Testing Calculator
How Statsig Works
Blog
Support
Customer Stories
Events
Build vs Buy
Contact Sales
Experiments with Generative AI
We built a generative AI app in reactJS using OpenAI’s API and Statsig. Here’s what we learned:
Experimentation Platforms
The decision to build versus buy an experimentation and feature flagging platform is not an easy one.
CUPED Explained
CUPED is an implementation that uses pre-experiment data to explain the variance in the result data.Product Updates
May 2024
Apr 2024
Mar 2024
Feb 2024
Jan 2024
Nov 2023
Aug 2023
Jul 2023
Jun 2023
Apr 2023
Mar 2023
Feb 2023
Jan 2023
Dec 2022
Nov 2022
Oct 2022
Sep 2022
Aug 2022
Jul 2022
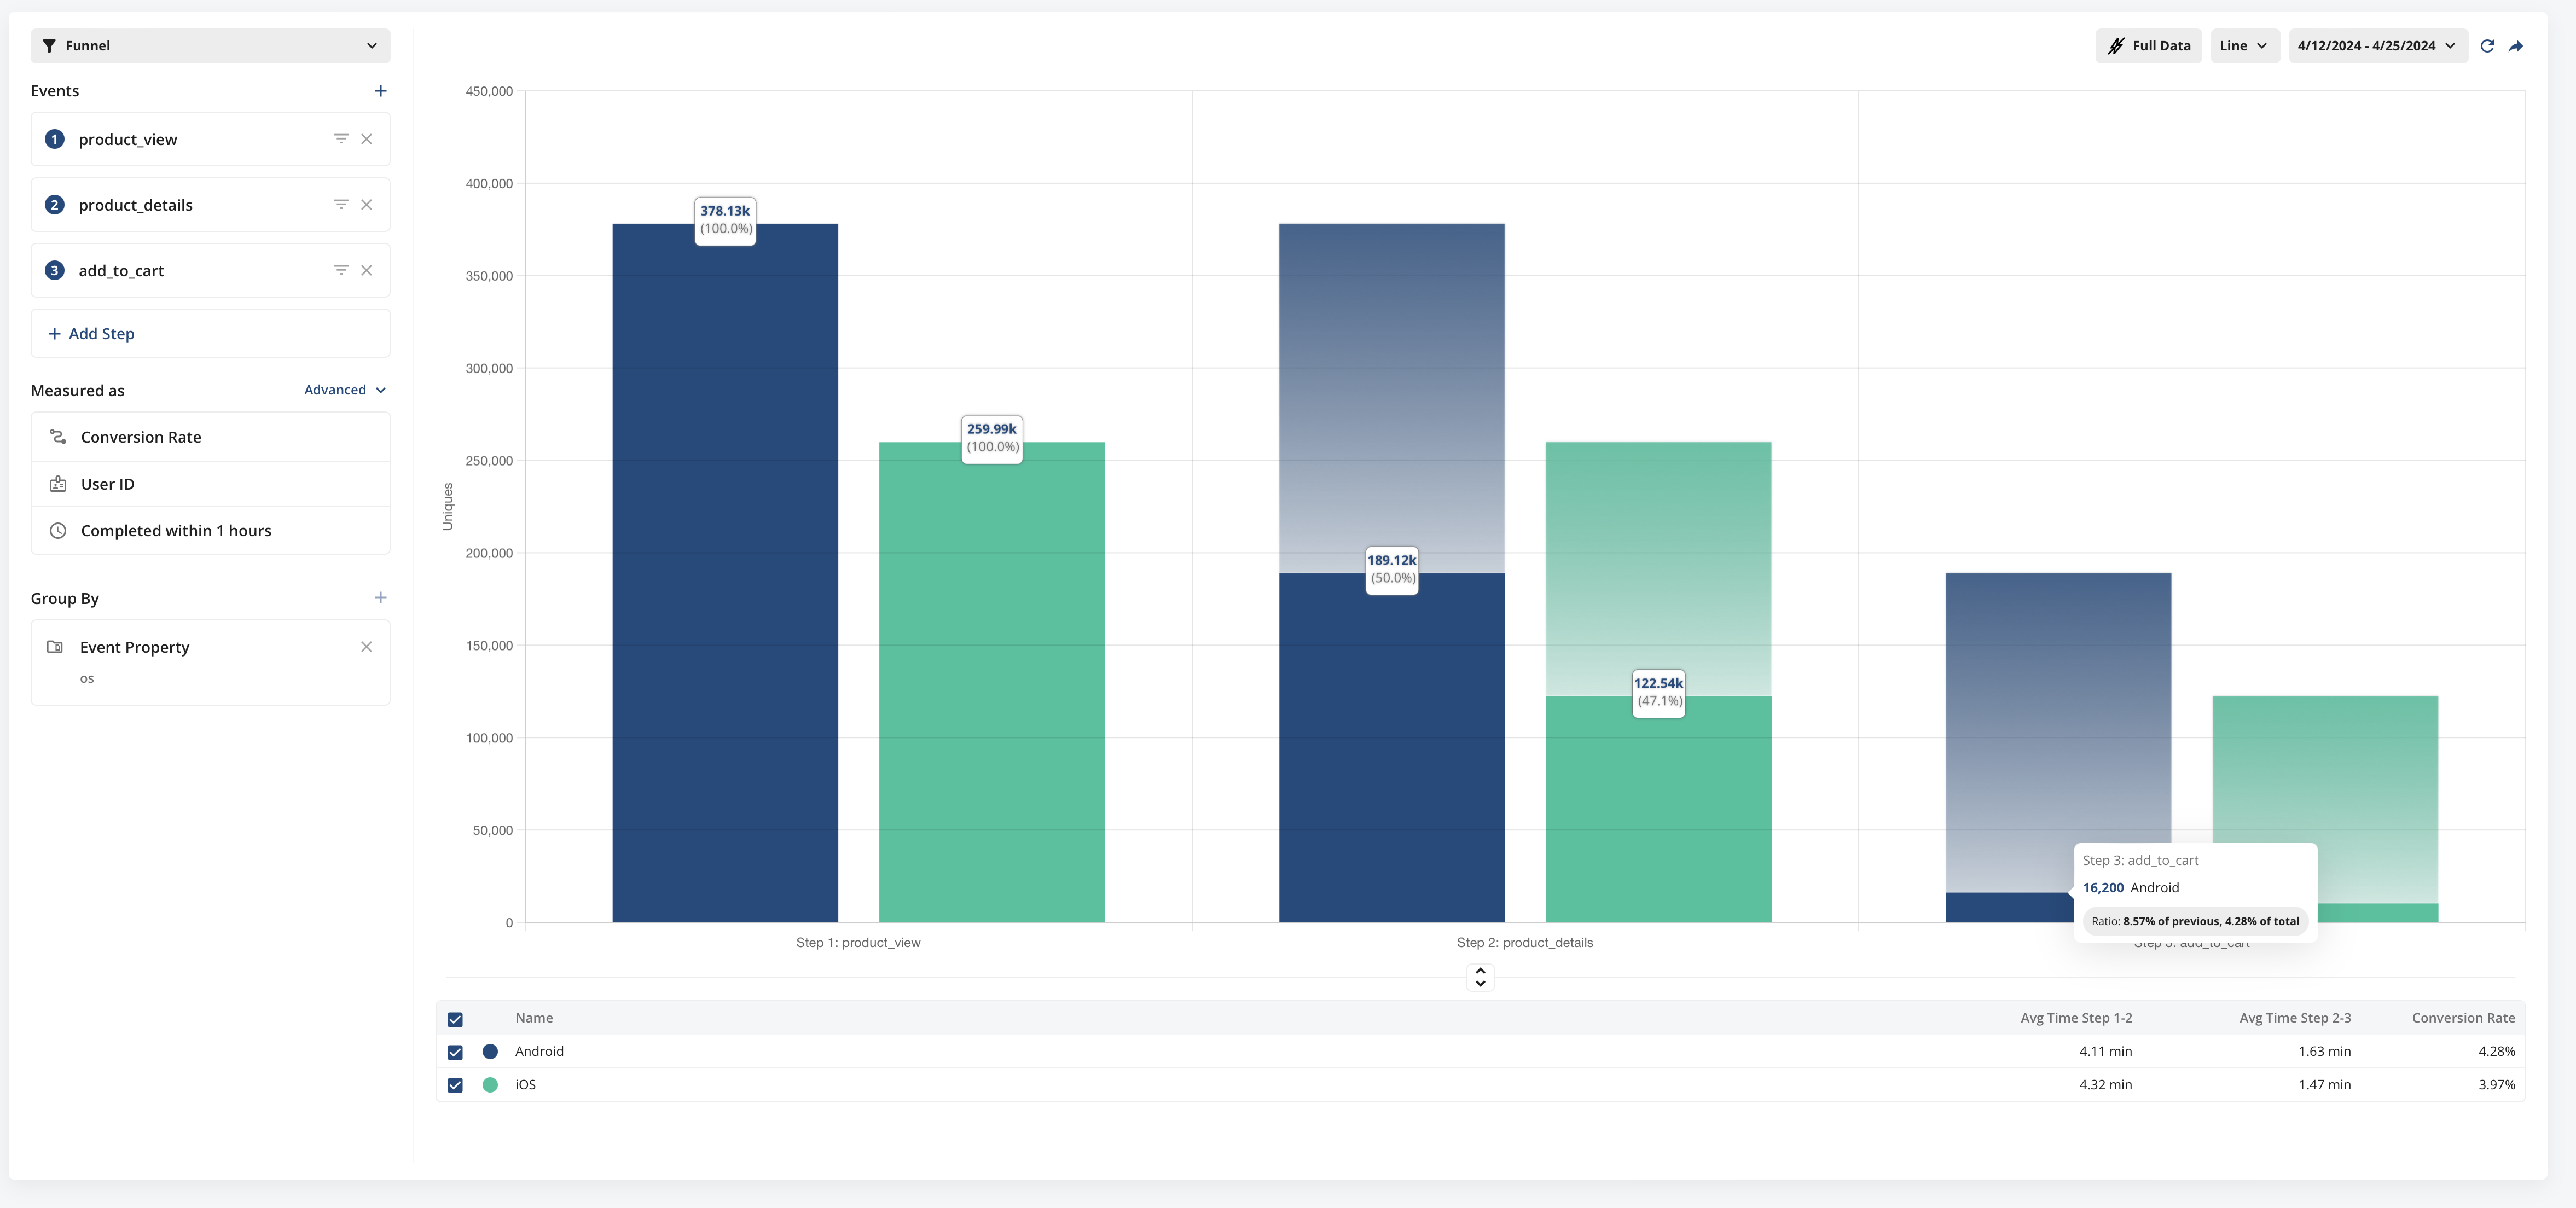
Funnels 2.0
We've recently launched our most significant updates to Funnels in Metrics Explorer to date. Funnels now have more useful configuration options, more information about people convert through your funnels, two new ways to view conversion information, and a better overall look and feel.
Funnel Views
You can now view funnels in three ways, Conversion Rate, Conversion Rate Over Time, and Time To Convert Distribution.
Conversion Rate
In this classic funnel view, you can visualize what portion of users convert through each step a funnel you define. This view is useful for understanding exactly where funnel drop offs are occurring and helps you focus efforts to make targeted improvements.
Conversion Rate Over Time
This view allows you to understand how your funnel performance is trending over time. This view is useful in detecting unexpected changes in funnel conversion, or validating that changes made to improve conversion are having the intended effect.
Time to Convert Distribution
This view allows you to understand the general distribution of time it takes to convert through the funnel. We show the percentage of converting funnels that convert within each of the time ranges on the x-axis. This is useful in understanding how long it generally takes people to convert through the funnel.
New Configuration Options
You now have granular control of the funnel conversion window. Set it anywhere from 1 second to 7 days.
In the advanced menu you can also select if the events in the funnel must be completed sequentially, or if completing the steps in any order counts as a conversion.
Time to Convert Information
In addition to the new Time-To-Convert funnel view, in the default Conversion Rate view, we now show time-to-convert information between each step of the funnel.
Coming Soon
We're planning to add additional configuration options very soon including
Unique Conversion or Overall Conversion - choose whether to only count the unique individuals that converted through the funnel, or total funnel conversions that occurred
Strict Step Ordering - Require events in the exact order defined (with no events between)
Exclusion Events - Exclude Funnels that contain specific events between steps
Hold Property Constant - Only count funnels where a given property remains constant through each step.
Integration with Session Replays - View users who didn't convert and see replays that help you gain contextual understanding for why they didn't convert.

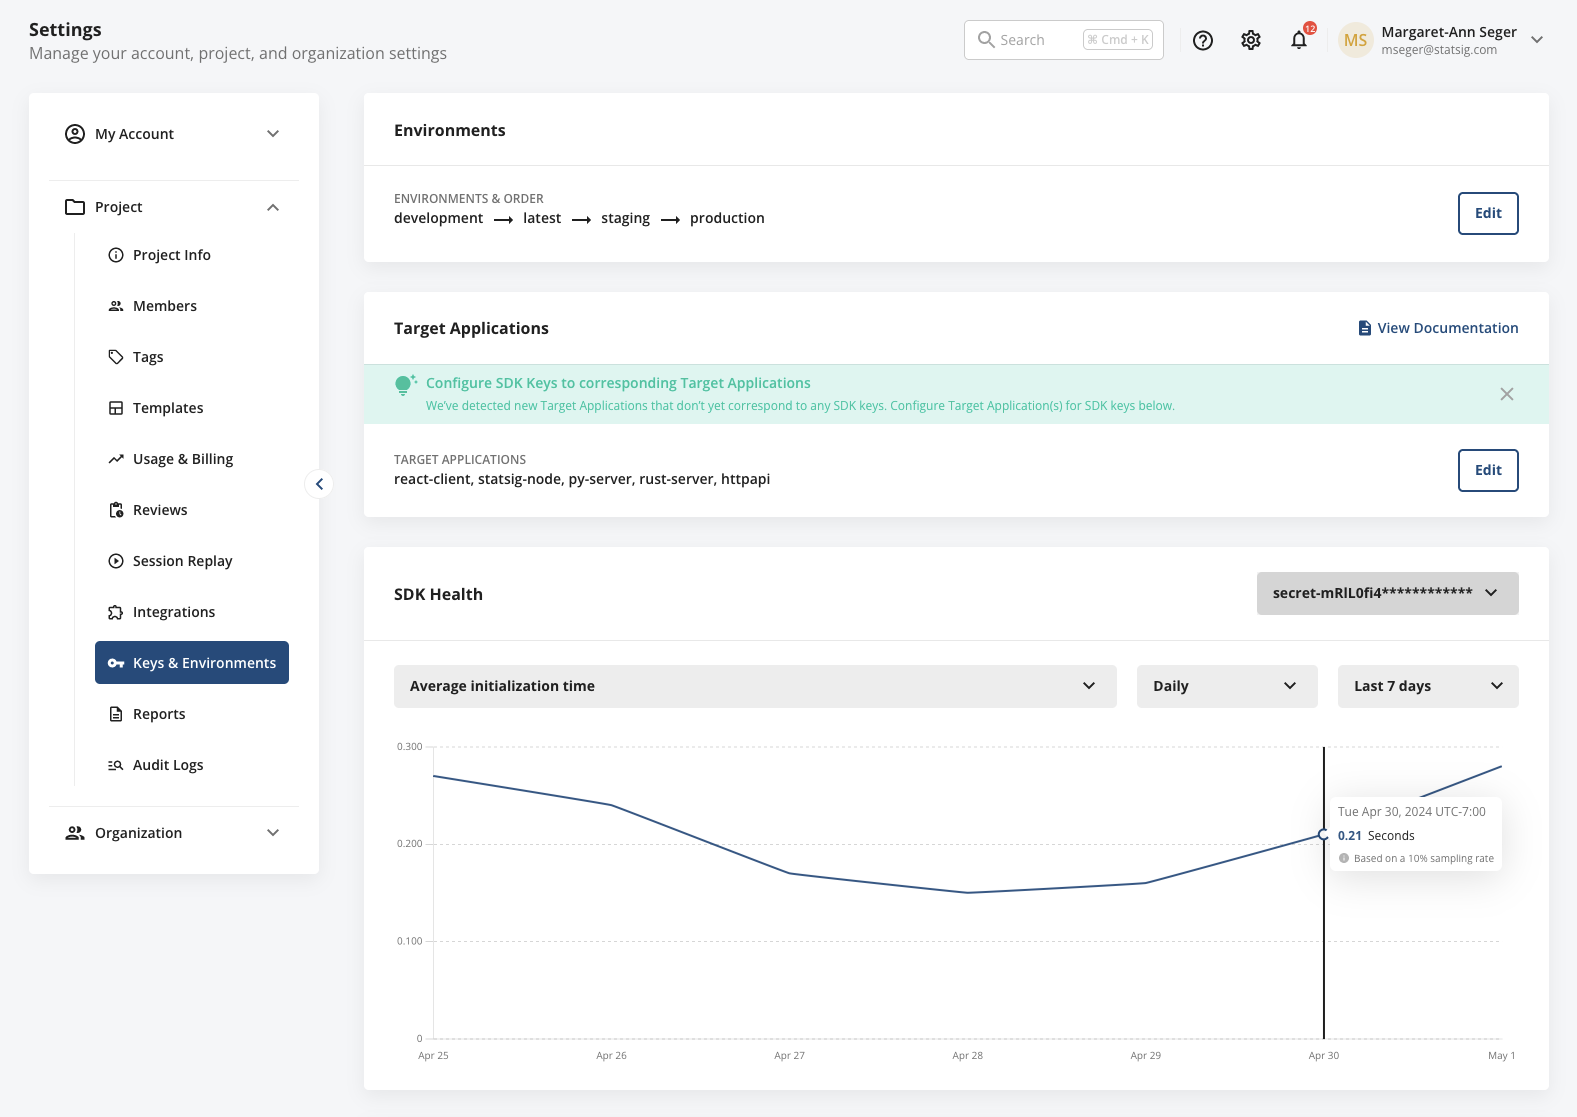
🫀 SDK Health Visibility
While the Statsig Console is the face of most customers’ experience with Statsig, much of the power of Statsig happens “behind the scenes” via Statsig’s SDKs. Today, we’re excited to unveil a set of SDK performance stats to enable customers to stay abreast of their SDK health, including:
Download config spec size
Success rate
Average initialization time
… with more stats coming soon!
These stats are accessible alongside your SDK keys in Settings → Project Settings → Keys & Environments and can be viewed hourly or daily, over any custom date range.
Threshold Metrics on WHN
Sum and count metrics can now be configured to use a threshold. When using a threshold, the metric will measure if the user's sum or count metric surpassed a given threshold. This is usually combined with cohort windows to create a metric like "% of users who spent more than $100 in their first week".
This is currently available on Statsig Warehouse Native. Learn more.
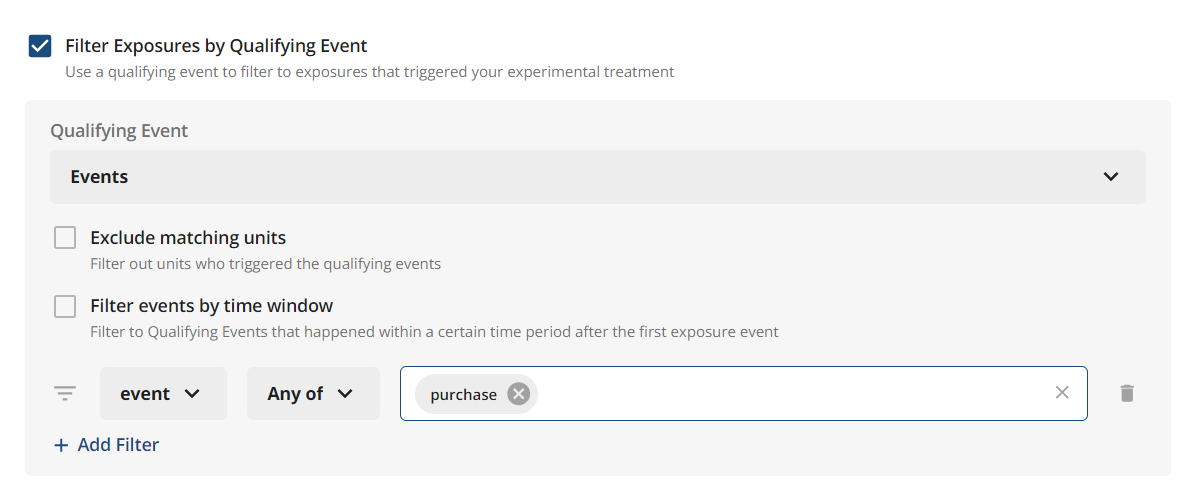
Experiment Assignment (Exposure) Filtering on WHN
For some experiments, assignment and exposure are separate events (e.g. you may need to generate a web page that has an experiment at the bottom of the page. Users are exposed only if the user scrolls down and sees the experiment). When using Statsig SDKs you can use getExperimentWithExposureLoggingDisabled on assignment and manuallyLogExperimentExposure at the point of exposure.
If you are using a 3rd party SDK, you can filter exposures based on a Qualifying Event. You can choose to filter assignments to only include subjects that have either generated (or not generated) a qualifying event - possibly within a
You can find these settings in the Advanced options of the Setup page when creating an Analyze-only Experiment.
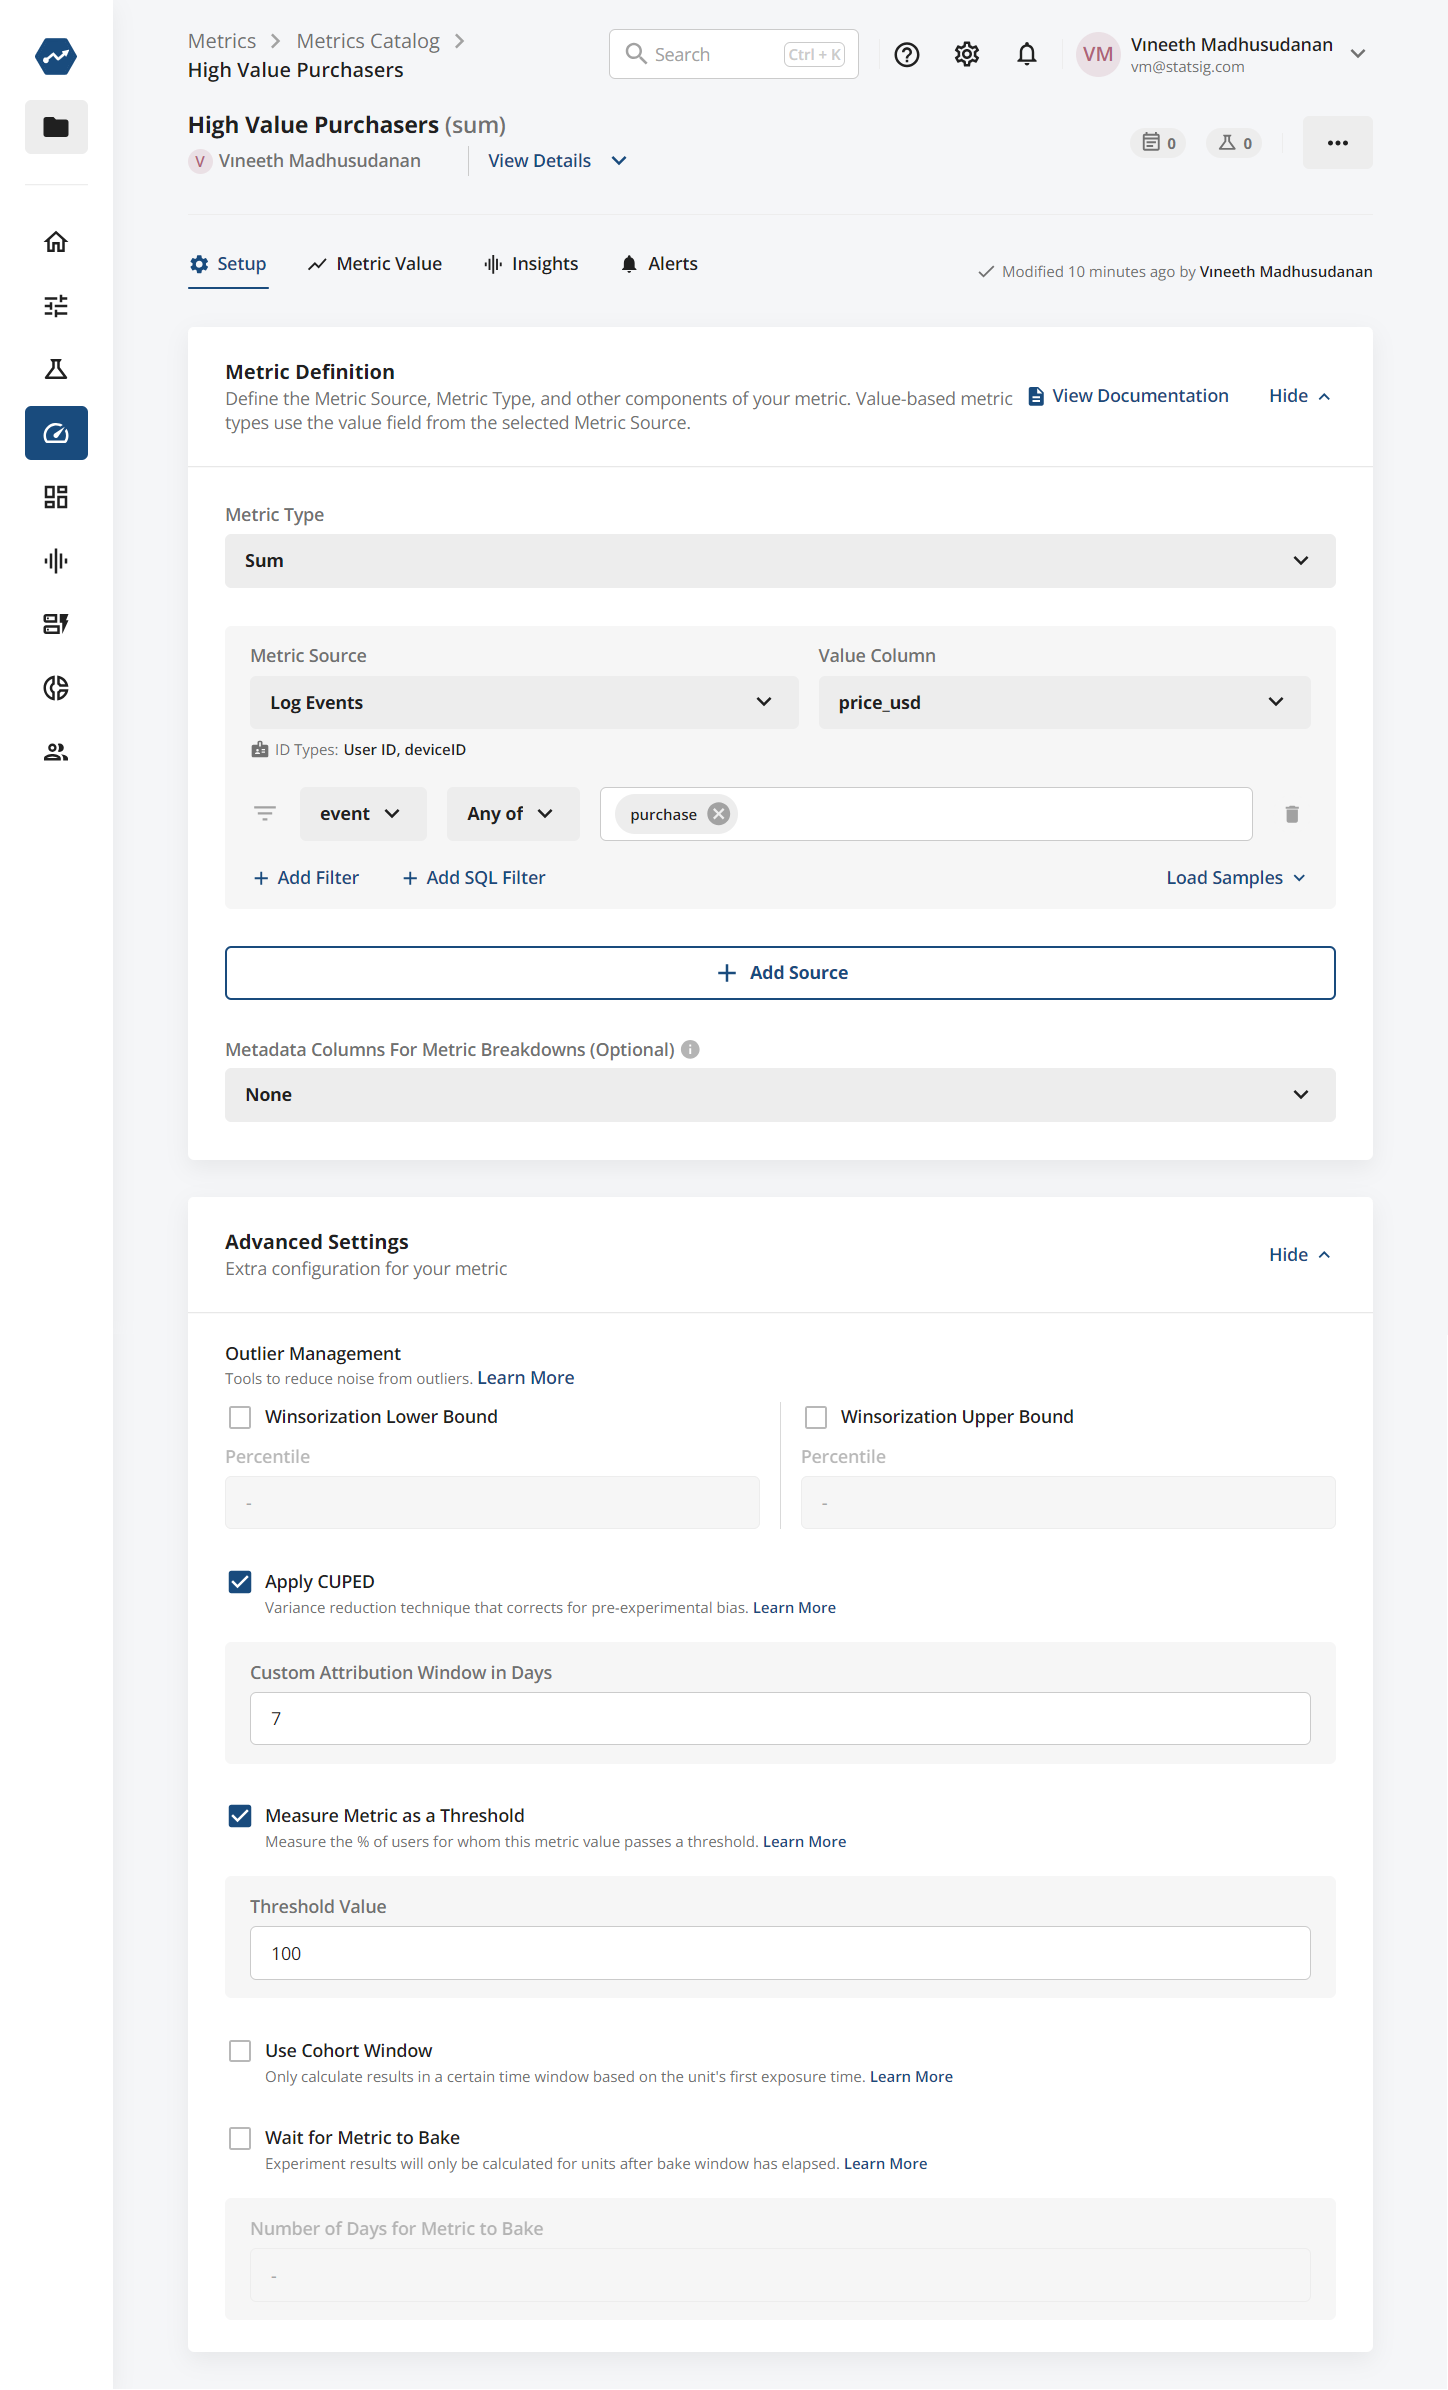
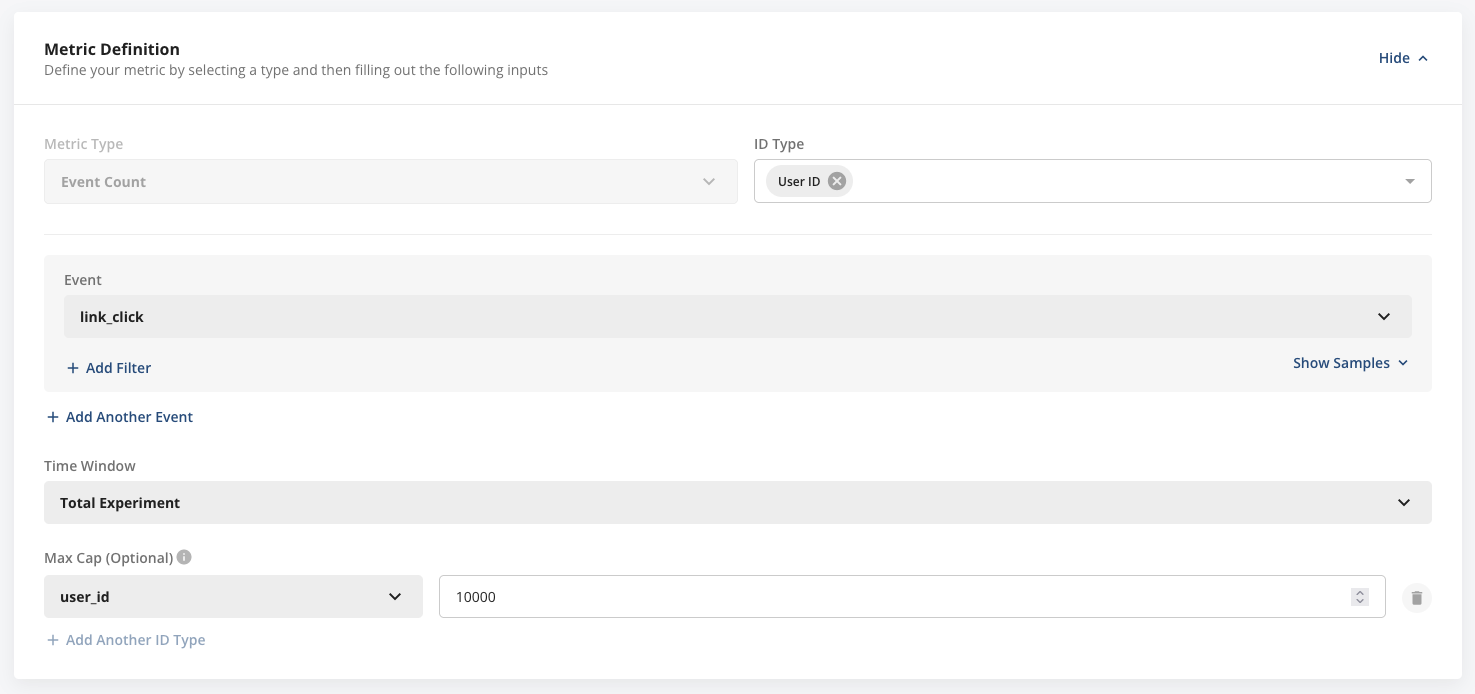
🧢 Capped Metrics
Today, we’re excited to roll out Capped Metrics. With this capability, you can define max values for a metric for whatever unit type(s) are configured for this metric. Any value surpassing the set cap will automatically be adjusted downward to match it.
For instance, if you determine that purchases greater than $10,000 per day on your E-commerce platform should not skew analysis, any transaction exceeding this threshold will be adjusted downward to this limit, ensuring the integrity of your experiment analysis.
Capped metrics are available for Event Count and Aggregation (sum) metric types. Read more in our docs.
This is rolling out on Statsig Cloud and coming soon on Statsig Warehouse Native.
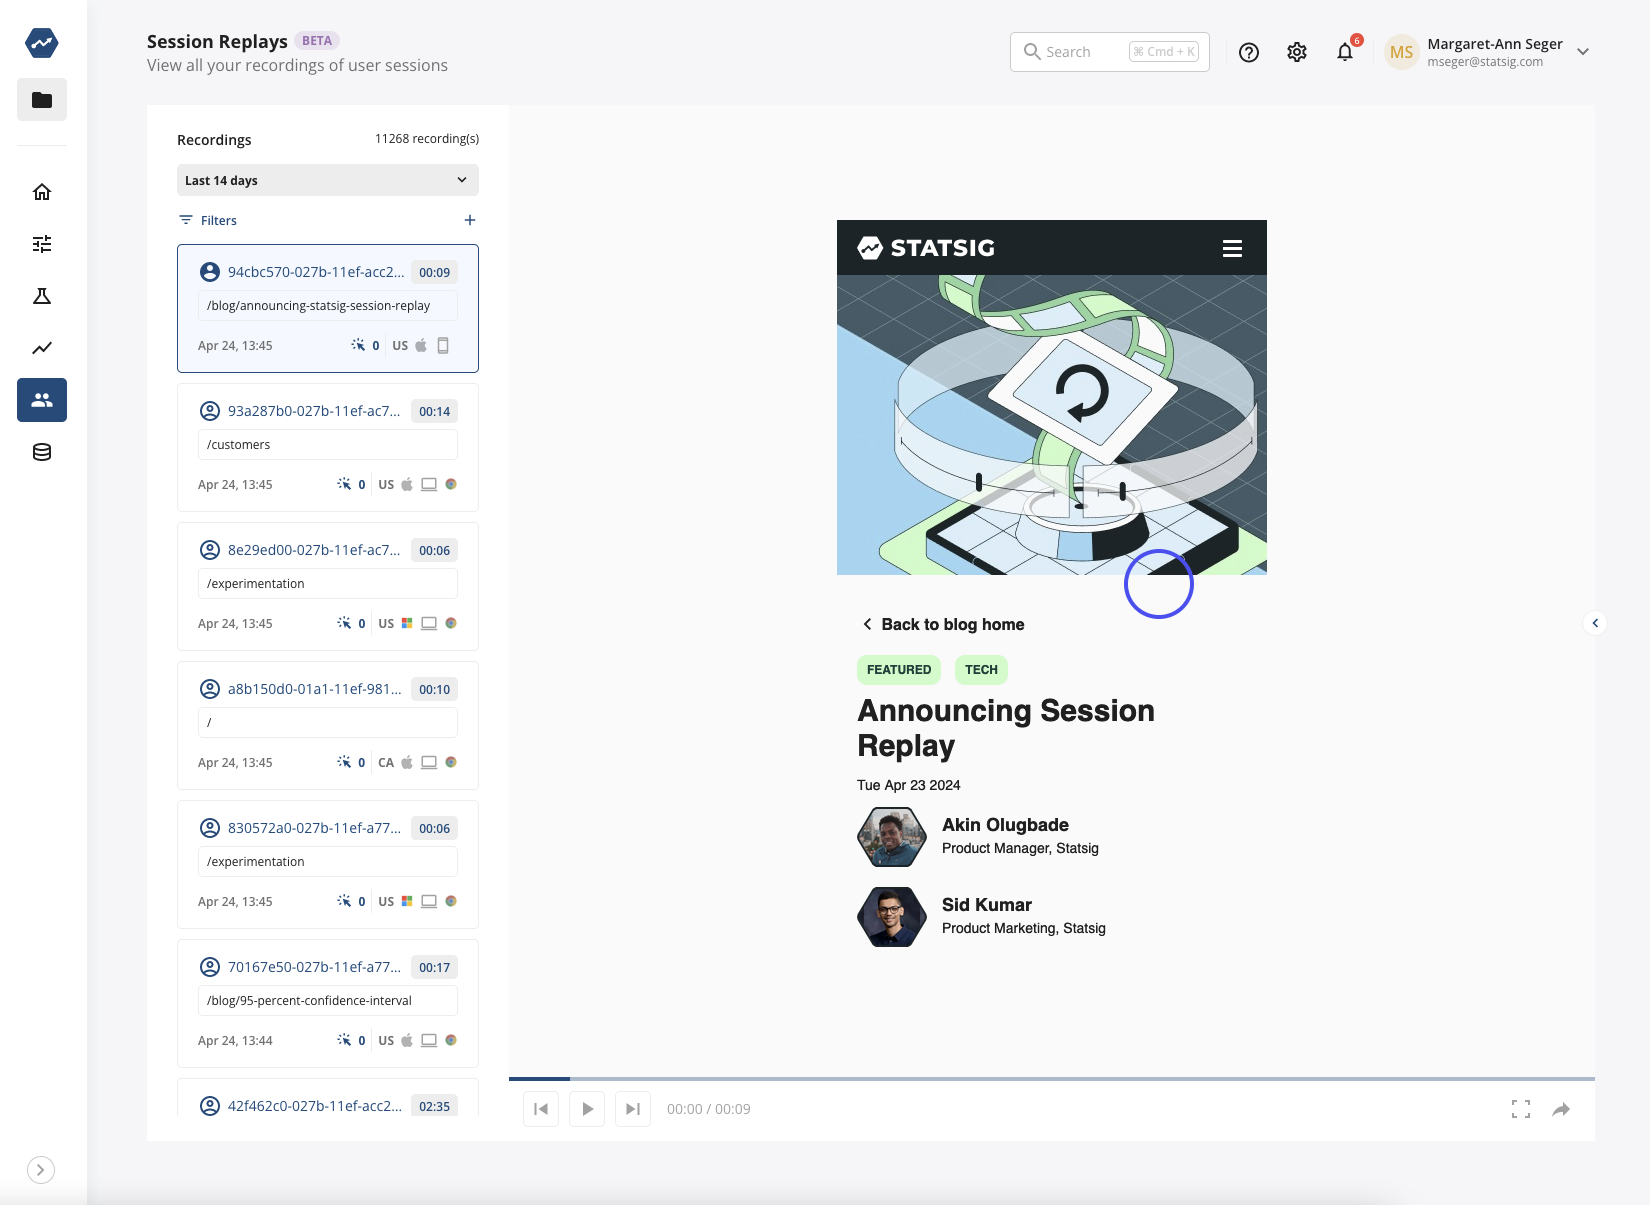
Announcing Session Replay Beta
We're excited to introduce Session Replay, our new tool designed to give you a clearer understanding of how users interact with your product. This feature complements our existing Product Analytics by providing qualitative insights that help explain the reasons behind user behaviors.
Session Replay allows you to visually track a user's journey through your app or website. For example, if Product Analytics shows that users are dropping off at a particular step in a signup or checkout process, Session Replay enables you to see what happened during those sessions. You might discover issues like unclear instructions, overly complex UI, or missing information—factors that could lead to user frustration or abandonment.
For startups, Session Replay is particularly beneficial. We offer 10,000 free session replays each month, making it accessible for new businesses to start optimizing user experiences right away. Setup is straightforward: integrate a code snippet or use a package manager to enable autocapture and begin recording sessions. This tool not only helps identify where users encounter problems but also supports your efforts to make informed decisions to improve design and functionality.
Together with Product Analytics, Session Replay enriches your understanding of user interactions by adding context to the data you collect. This integration helps you make more targeted improvements, enhancing user satisfaction and conversion rates. If you're already using Statsig for Product Analytics, adding Session Replay is a seamless step to gain deeper insights into the 'why' behind the data. Get started today and enhance your ability to observe, analyze, and respond to user needs.
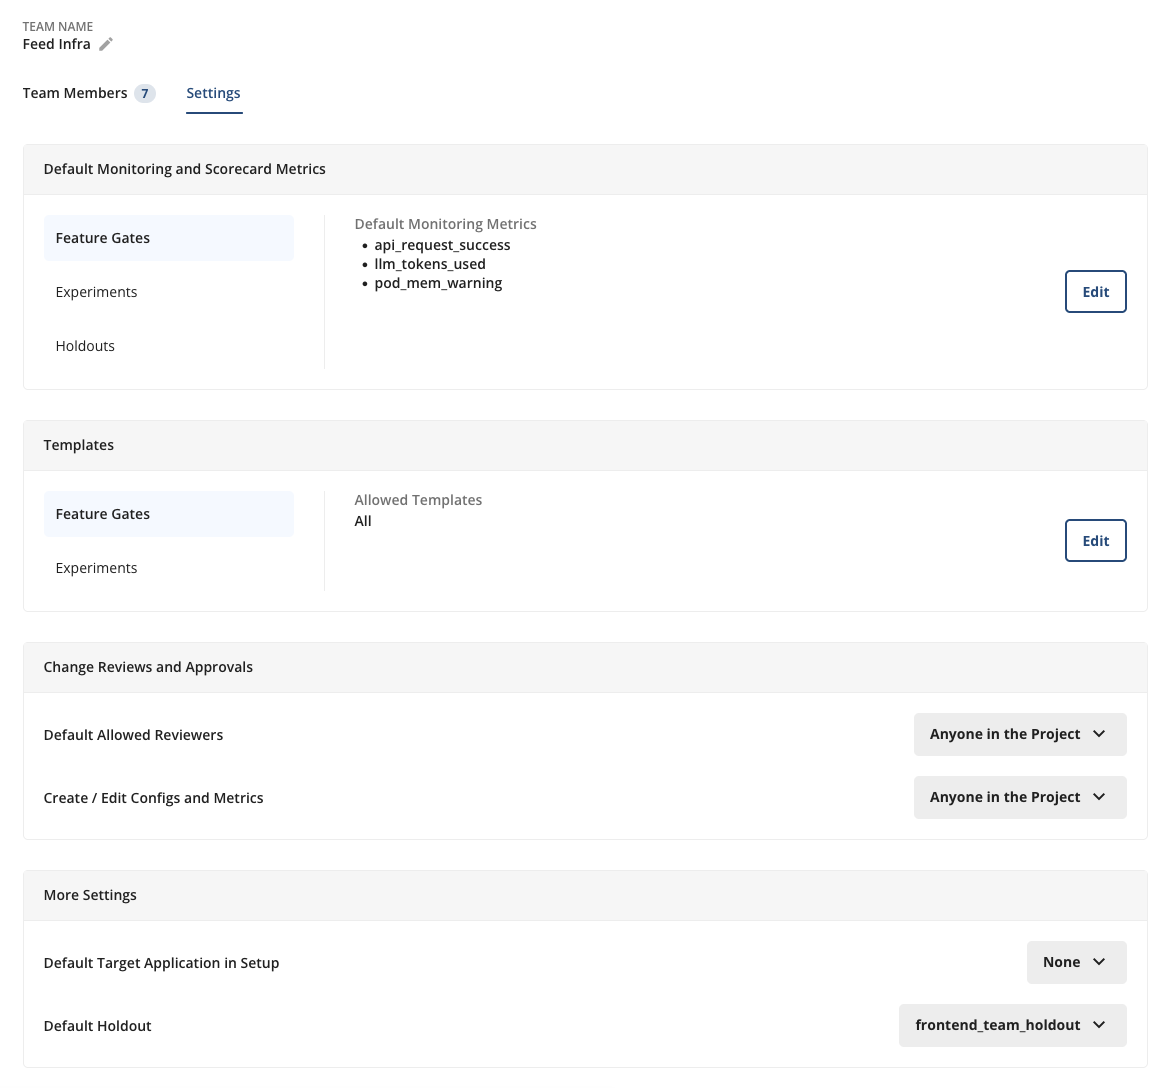
👥 Teams Configuration Settings
We're continuing to build on the recently-launched Teams functionality with a spate of new settings to more granularly control Project Settings at the team-level. New settings include:
Require Teams- Project setting to require all config creations are tied to a team, for easy categorization
Require Reviews- Team-level setting to require reviews at the team level (if reviews aren't already required at the project-level)
Default Holdout- Setting to automatically add all of a team's configs to a specified holdout to track cumulative impact over the course of a Quarter, Half, etc.
Teams are a powerful new organizational mechanism in the Statsig Console to make tracking configs, product changes, and business impact easier than ever at the team level.
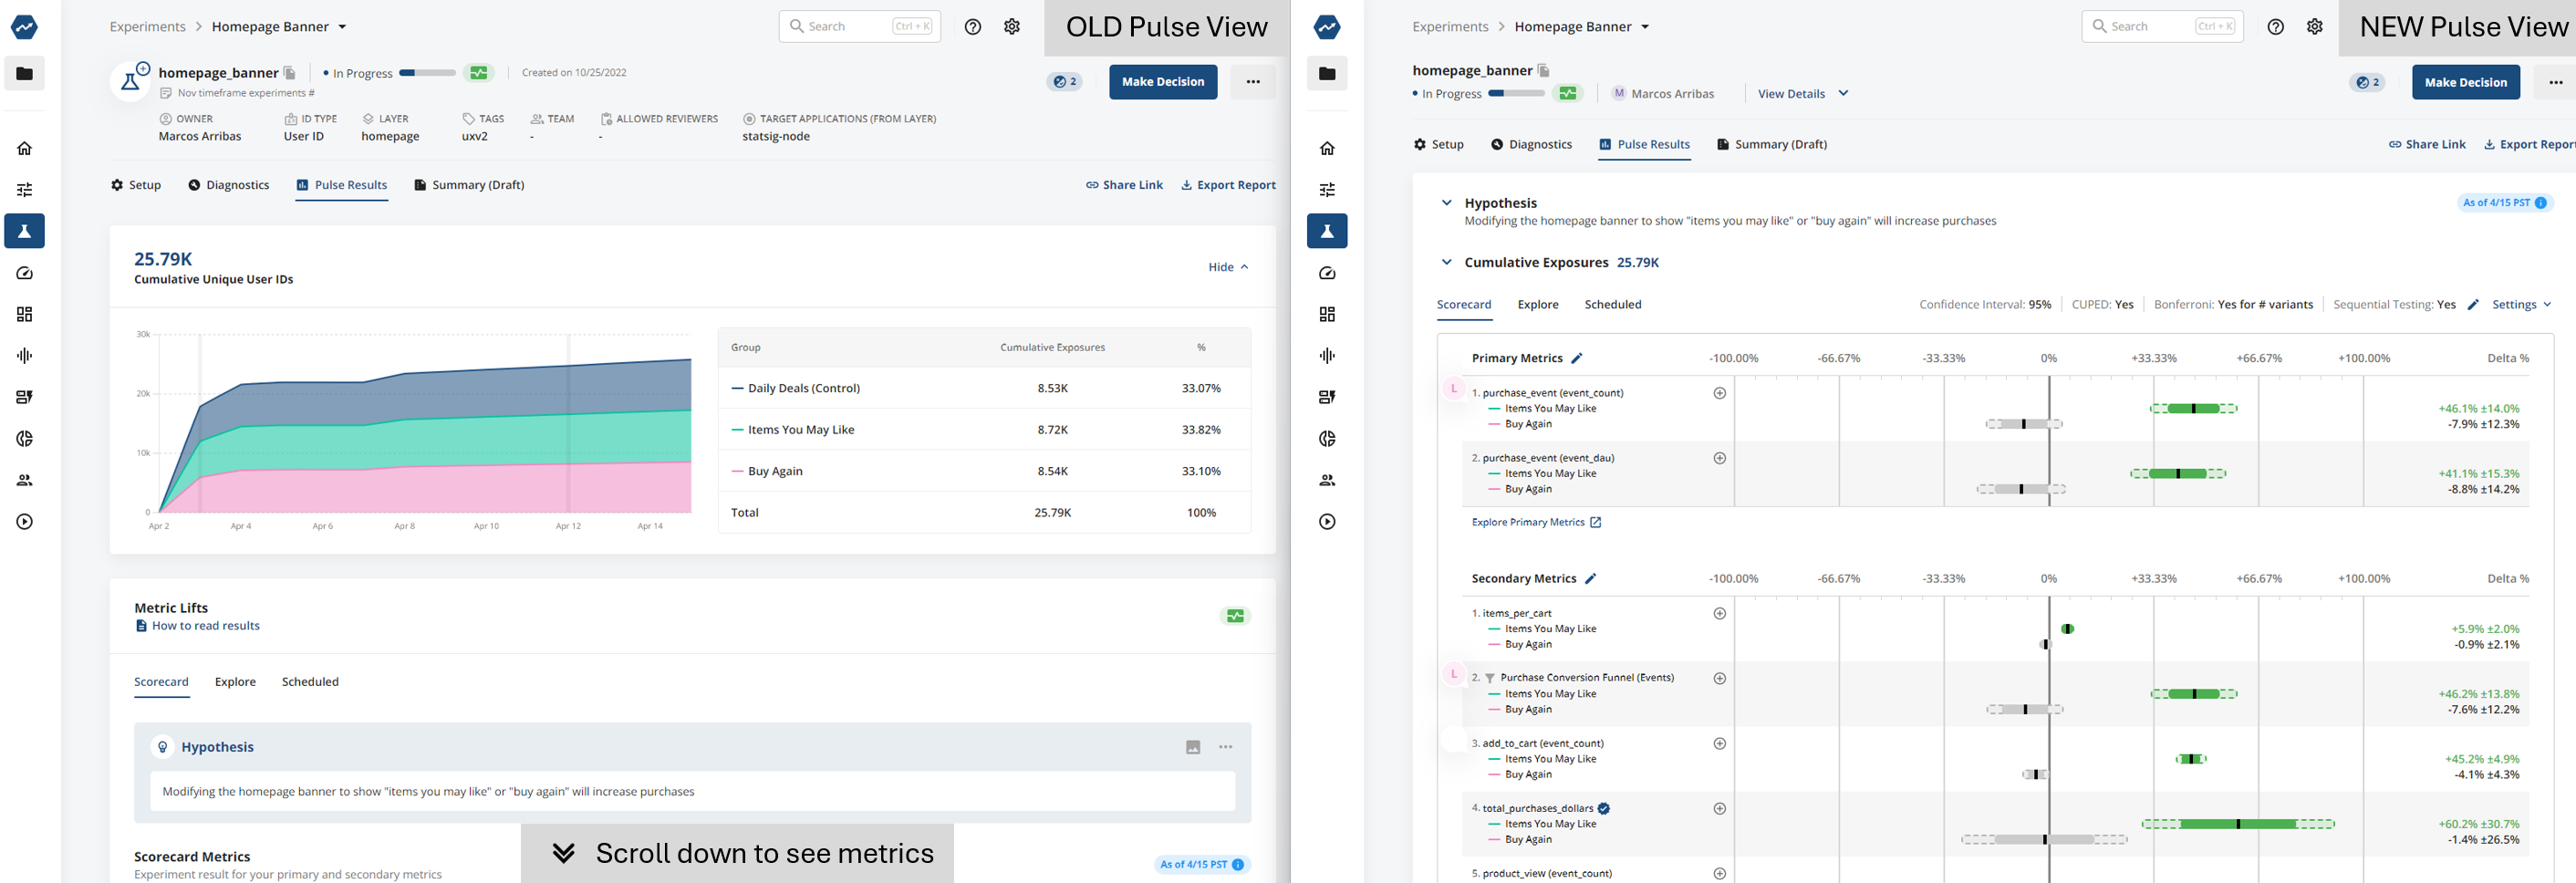
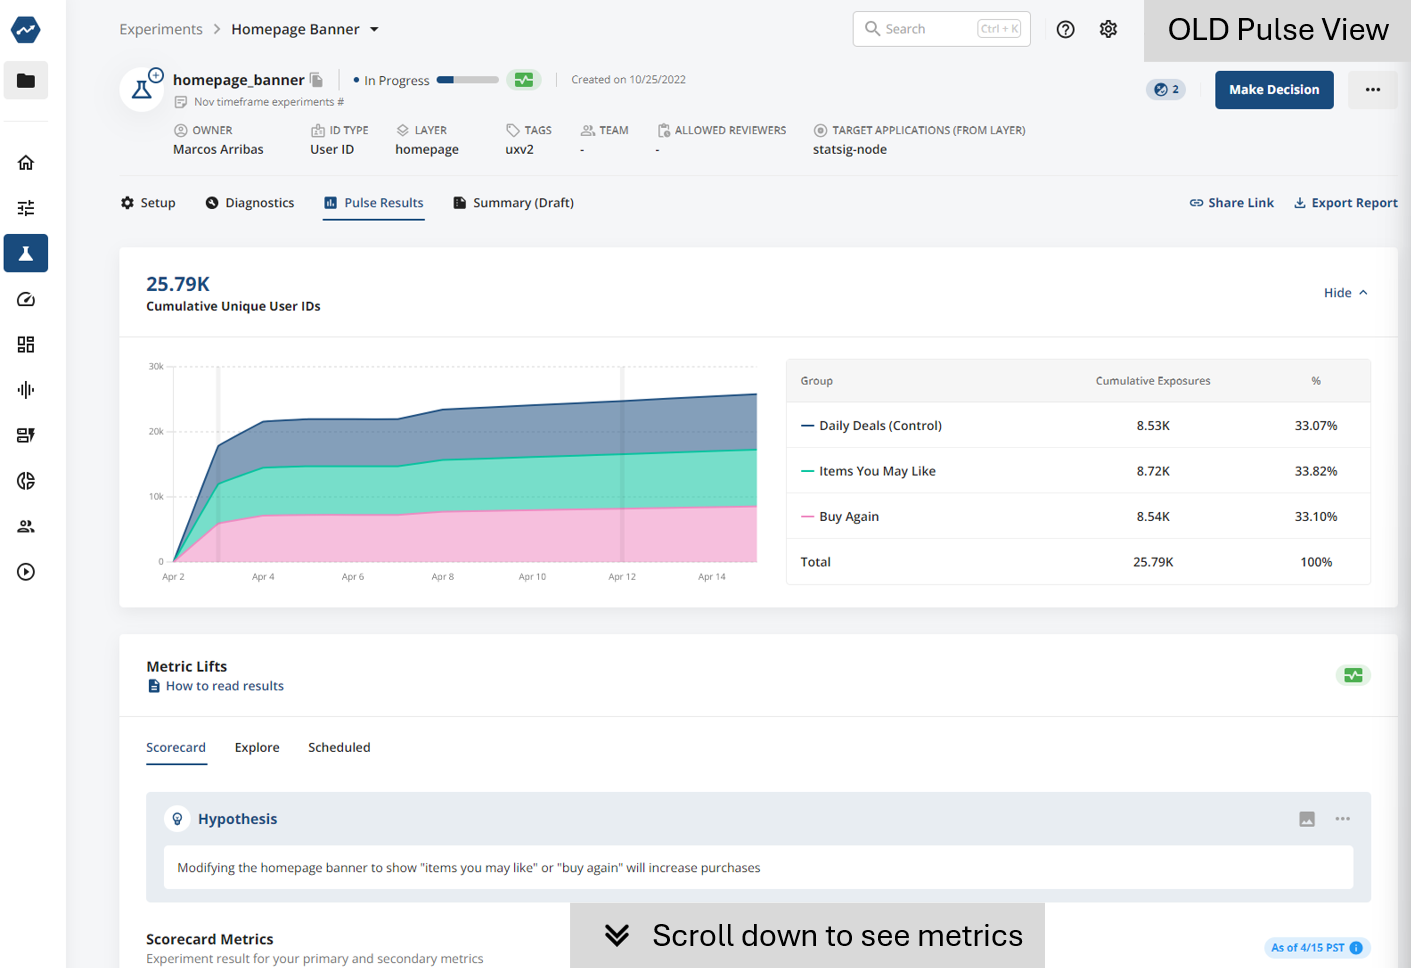
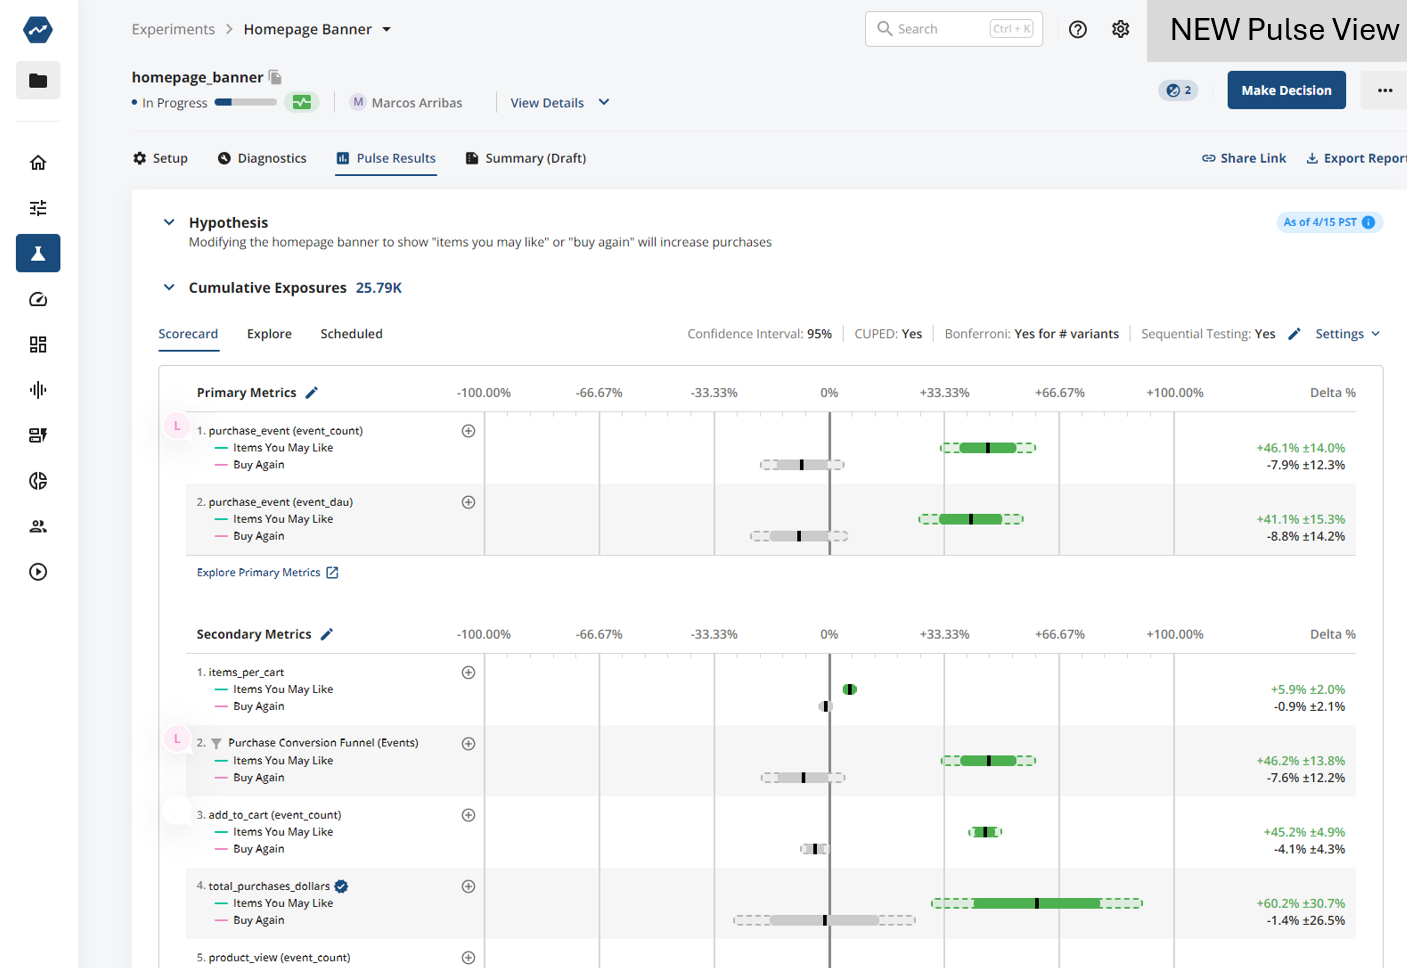
Refreshing Pulse (Experiment Scorecards)
Coming soon to Statsig is a new look to Pulse - our Experiment Scorecard page. As we added more features to this page (Target Apps, Allowed Reviewers, Hypothesis...) metric lifts got pushed off the screen. The new version will bring back focus on the metrics when the experiment is running. You can still access any of the context you're used to with one click.
The Summary tab is unchanged with this refresh. Reach out in Slack with any feedback you have - we're keen to listen as we make this view better.
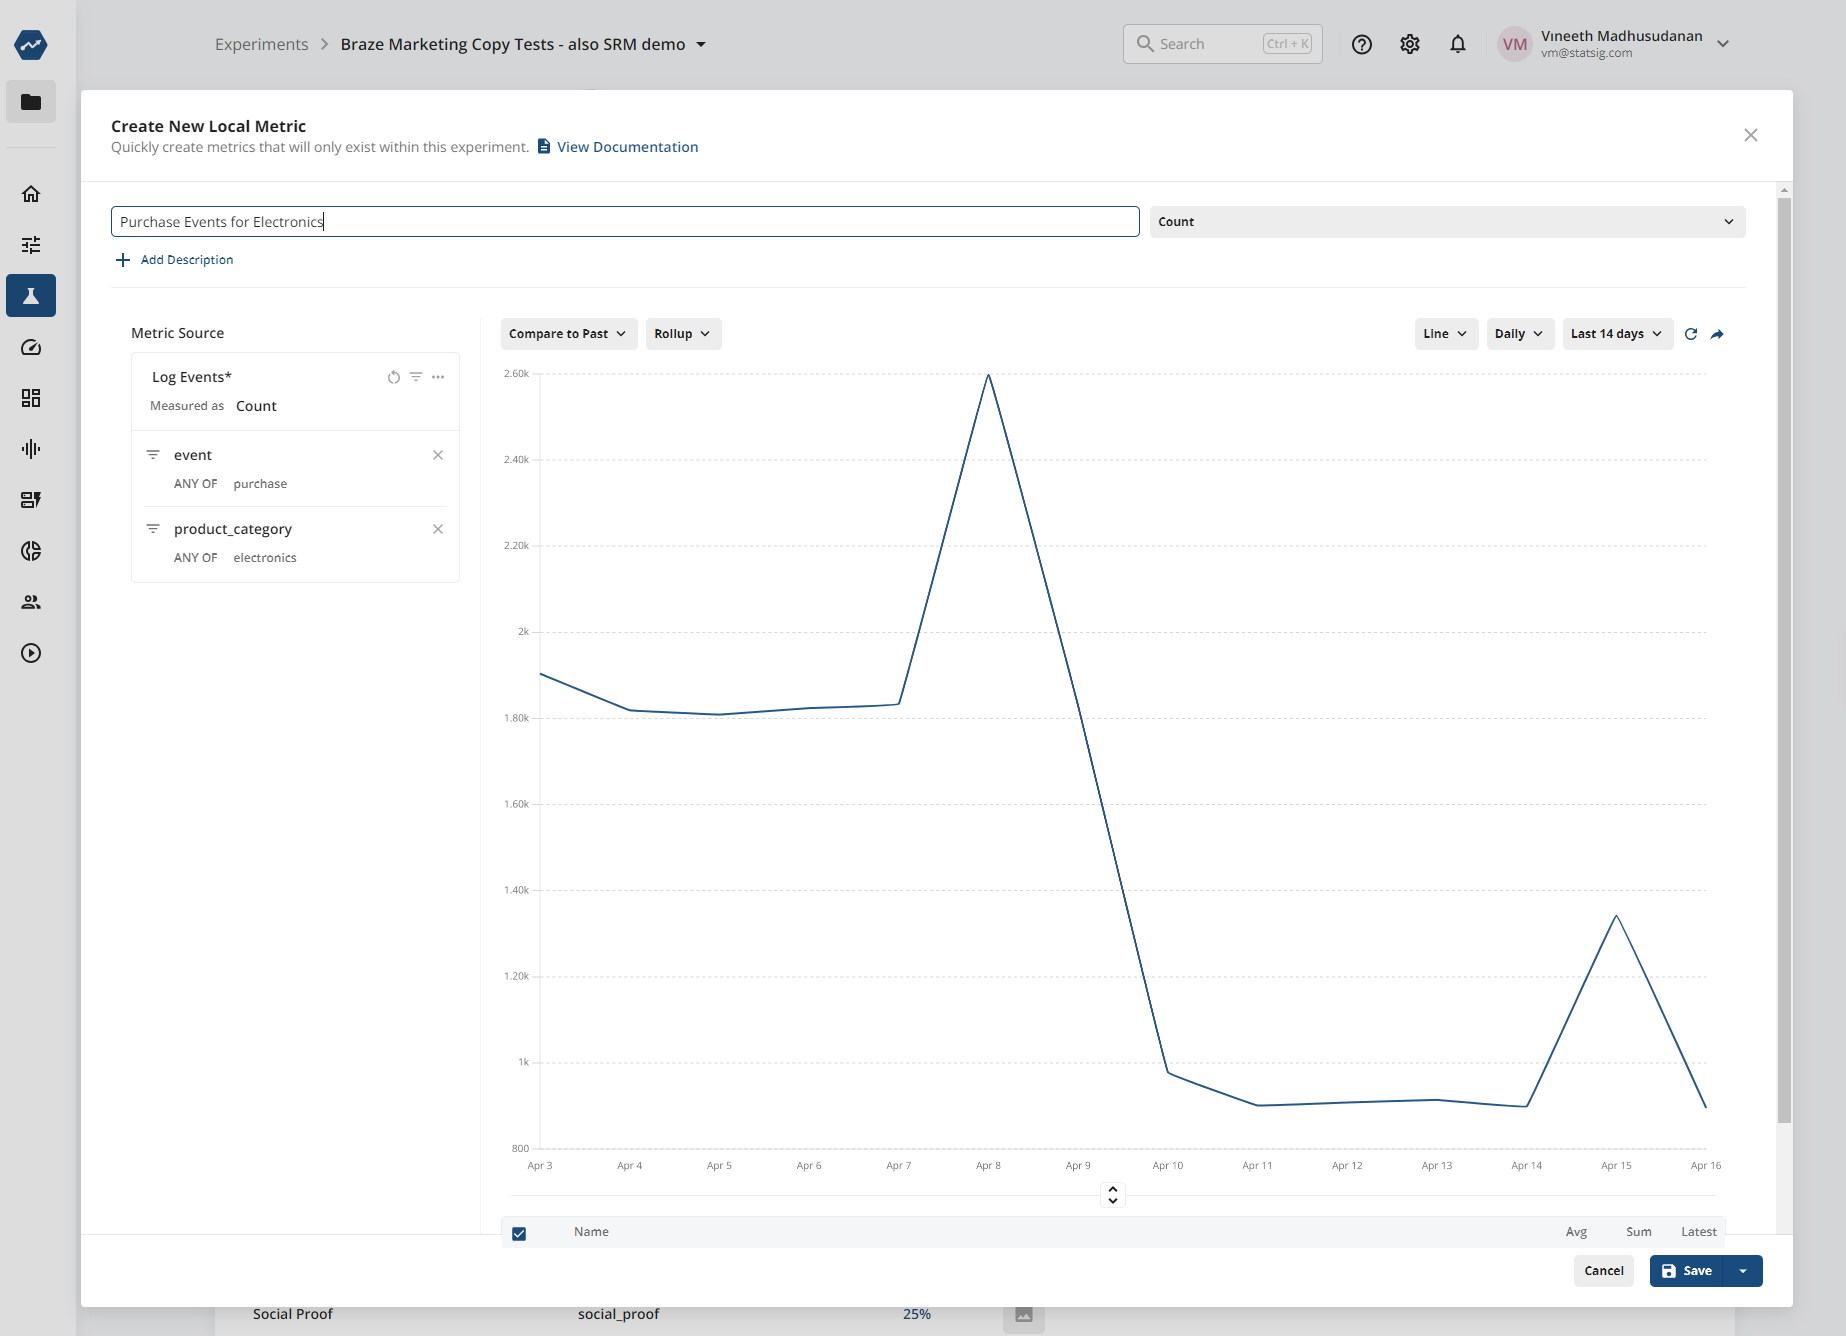
📍 Local Metrics on Warehouse Native
Local Metrics are metrics that are scoped to an individual experiment. They let you create the exact specific custom metric you want to measure in the context of your experiment or gate, without having to clutter up your Metrics Catalog on an ongoing basis.
Local Metrics can be created from the Setup tab sections of your entity, will be calculated for the duration of your experiment or rollout, and then will cease to exist when you make a decision on your experiment.
This rolled out on Statsig Cloud recently, and is now available on Statsig Warehouse Native too.
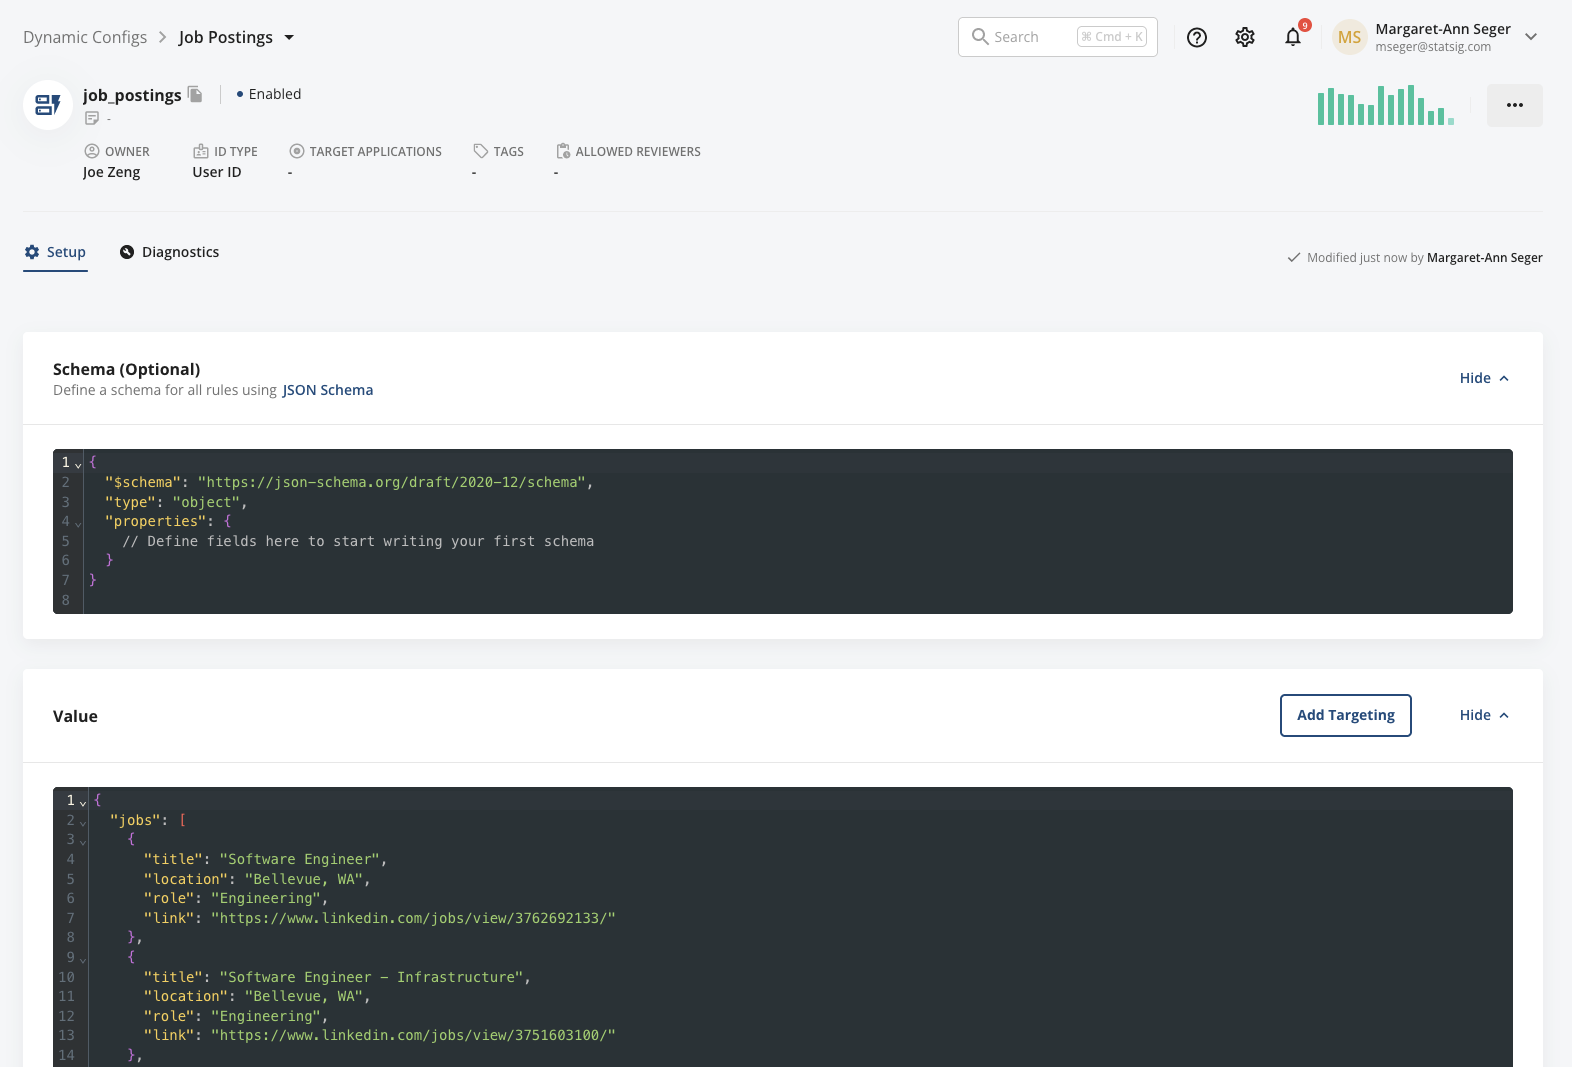
Schemas for Dynamic Configs
Today, we're excited to add the ability to define a schema for your dynamic configs, making it easier and less error-prone for multiple team members to collaborate together on dynamic configs.
To define a schema, you’ll see an optional “Schema” definition unit at the top of the page. When you add a schema, it will validate your rule & default return value JSON against this schema and block saving changes until the return values match the schema.
Join the #1 Community for Product Experimentation
What builders love about us